Build your K-12 curriculum with e-books you can trust
Britannica Collective delivers an essential digital learning tool for K-12 classrooms, coupled with objective, engaging, and diverse nonfiction content.
Supplement your curriculum
with content you can trust
Britannica’s comprehensive e-book titles offer an economical way to make authoritative, curriculum-aligned content available in your classrooms, libraries, or at home. Britannica’s content continues to be the prevailing trusted source for factual information and supports all subject areas, including:
Language Arts
Math
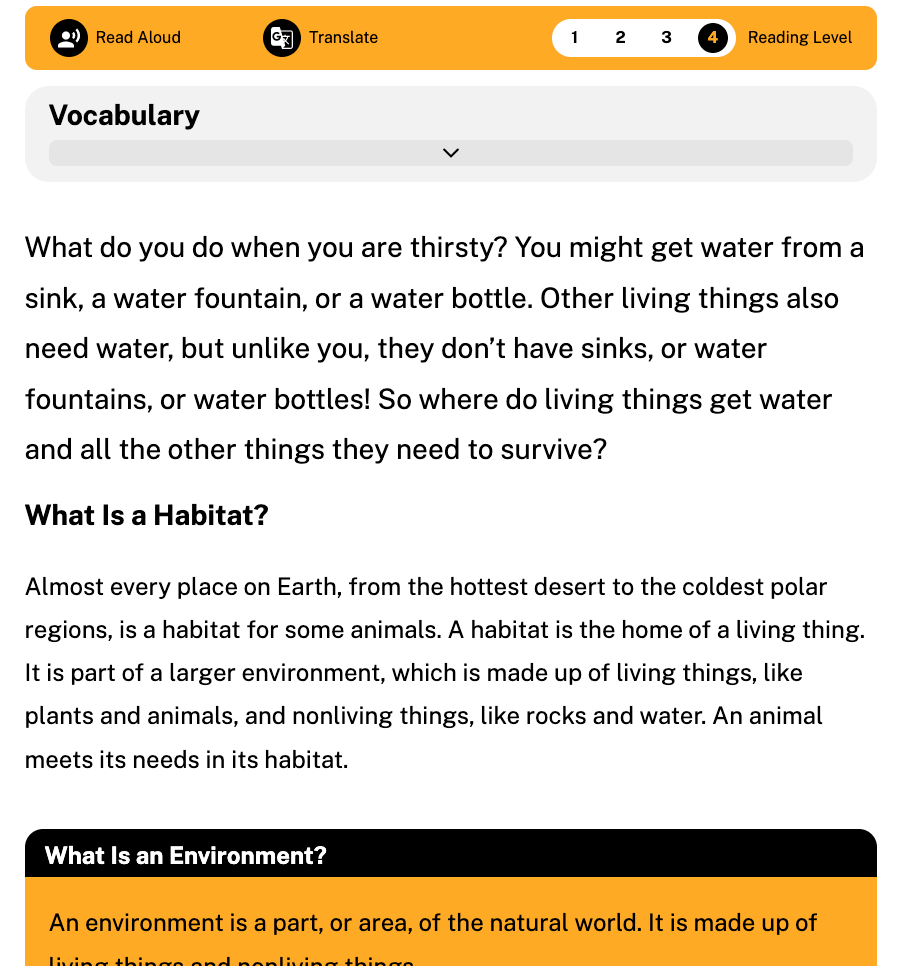
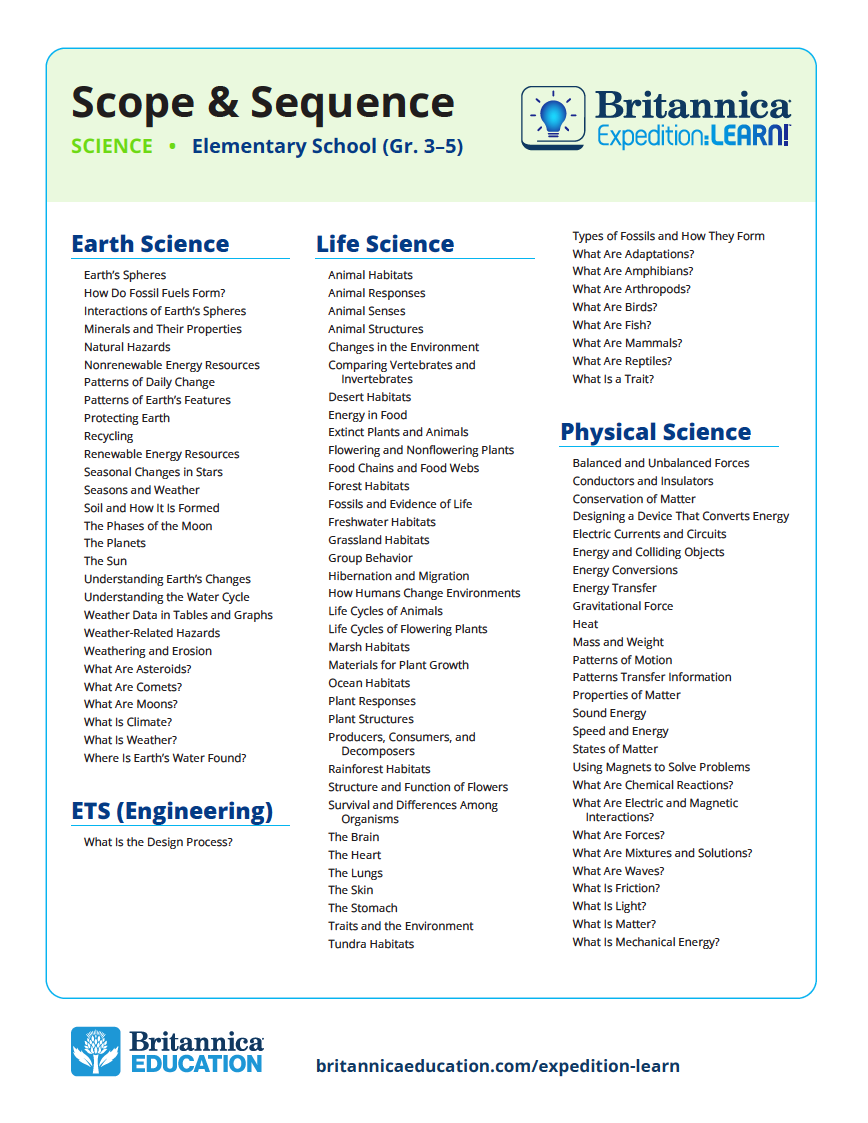
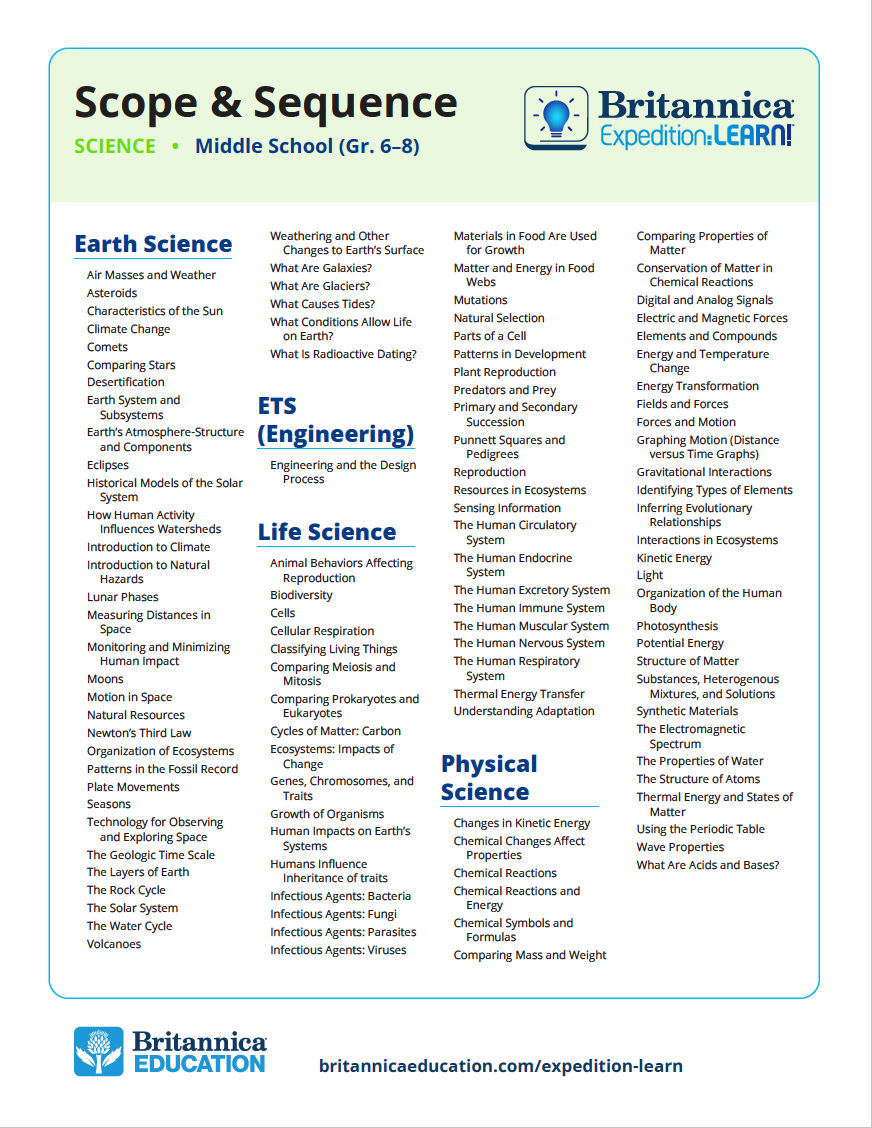
Science
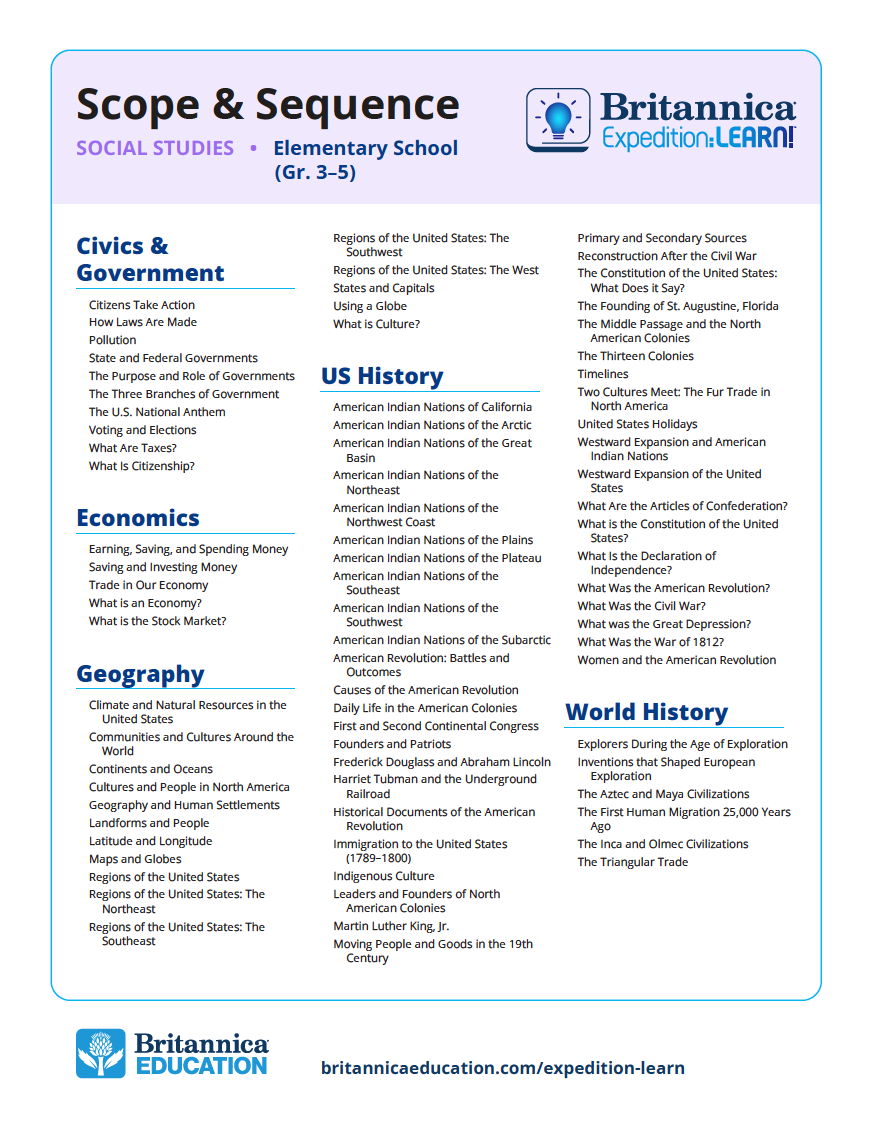
Social Studies
Sports
The Arts
Languages
Language Arts
Math
Science
Social Studies
Sports
The Arts
Languages
Explore Britannica’s content features
30+ Curriculum Collections
For elementary, middle, and high school levels, Britannica e-books provide a solid foundation of supplemental content to K–12 institutions.
Our curriculum collections:
Help educators meet curriculum needs and budgets in the most cost-effective way.
Build conceptual knowledge and critical-thinking skills for students of all ages.
Encourage students’ interest in a variety of subjects while energizing their curiosity through exploration and higher-order thinking.
Britannica Books
Britannica Books, launched in October 2020, is Britannica’s children’s publishing imprint, delivering innovative and inspiring nonfiction books for kids. Quickly becoming best-sellers and read by families around the globe, Britannica Books are designed to engage children’s natural curiosity and passion for learning.
Current titles:
All New Kids’ Encyclopedia
FACTopia!
Listified!
America from Coast to Coast
Britannica’s expert team of editors presents a carefully crafted brand new e-book series: America from Coast to Coast. The series contains one book for each state in the United States. Each book covers the state’s history, economy, local people and culture, land, government, and more!
E-books you can trust
Learn more about Britannica Collective
Let's connect.
E-books you can trust
E-books you can trust
Learn more about Britannica Collective
Let's connect! Schedule a 1:1 conversation with a Britannica representative.
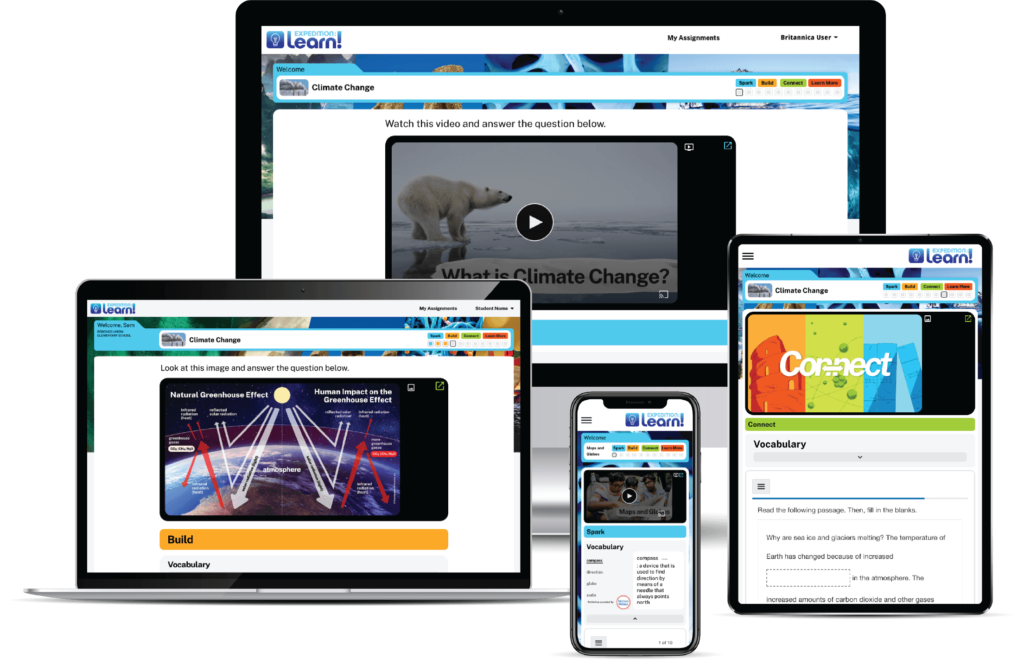
Personalize learning on a platform built for students
Britannica Collective embeds technology in classrooms while creating unique, relevant learning experiences for all users.
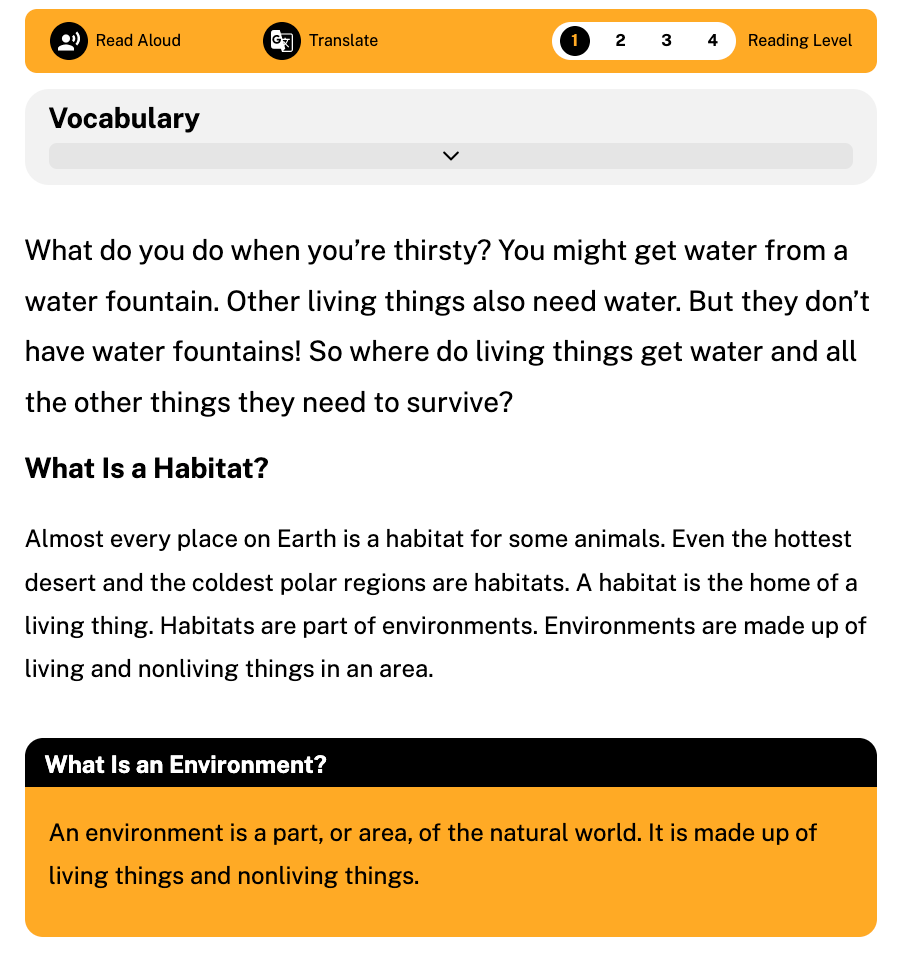
Deliver unique, level-appropriate content to students within the same class.
Gain individual insights through flexible and customizable assessments.
Develop student literacy skills through leveled content, based on their needs.
Britannica’s e-book platform allows educators to create standard and adaptive Assessments. Teachers can create multi-format assessments including multiple or single-choice answers, FIB, descriptive, or audio options.
Build an effective, impactful curriculum resource suite
Britannica Collective is the perfect compliment to your digital solution suite. Our cost-effective e-book collections pair with our suite of leading digital learning resources to provide a diverse depth and breadth of content offerings that meet your teaching and learning objectives. Connect with a Britannica team member to learn more.


